Column summaries: the numbers under the grid
One summary per column in the grid's footer — sum, average, median, counts — computed on the server over every record the view's filter matches.
Updated September 2026
The grid's bottom bar holds one summary slot per column. Click under Total, pick Sum, and the view answers its own question — how much money is on this screen — and keeps answering it as records change.
The number is computed on the server, over every record the view's filter matches — all of them, in one SQL query, not the pages the grid happens to have loaded. Sum of Total on a filtered 100,000-row view is the sum of every matching row, whether you've scrolled past 200 of them or none.
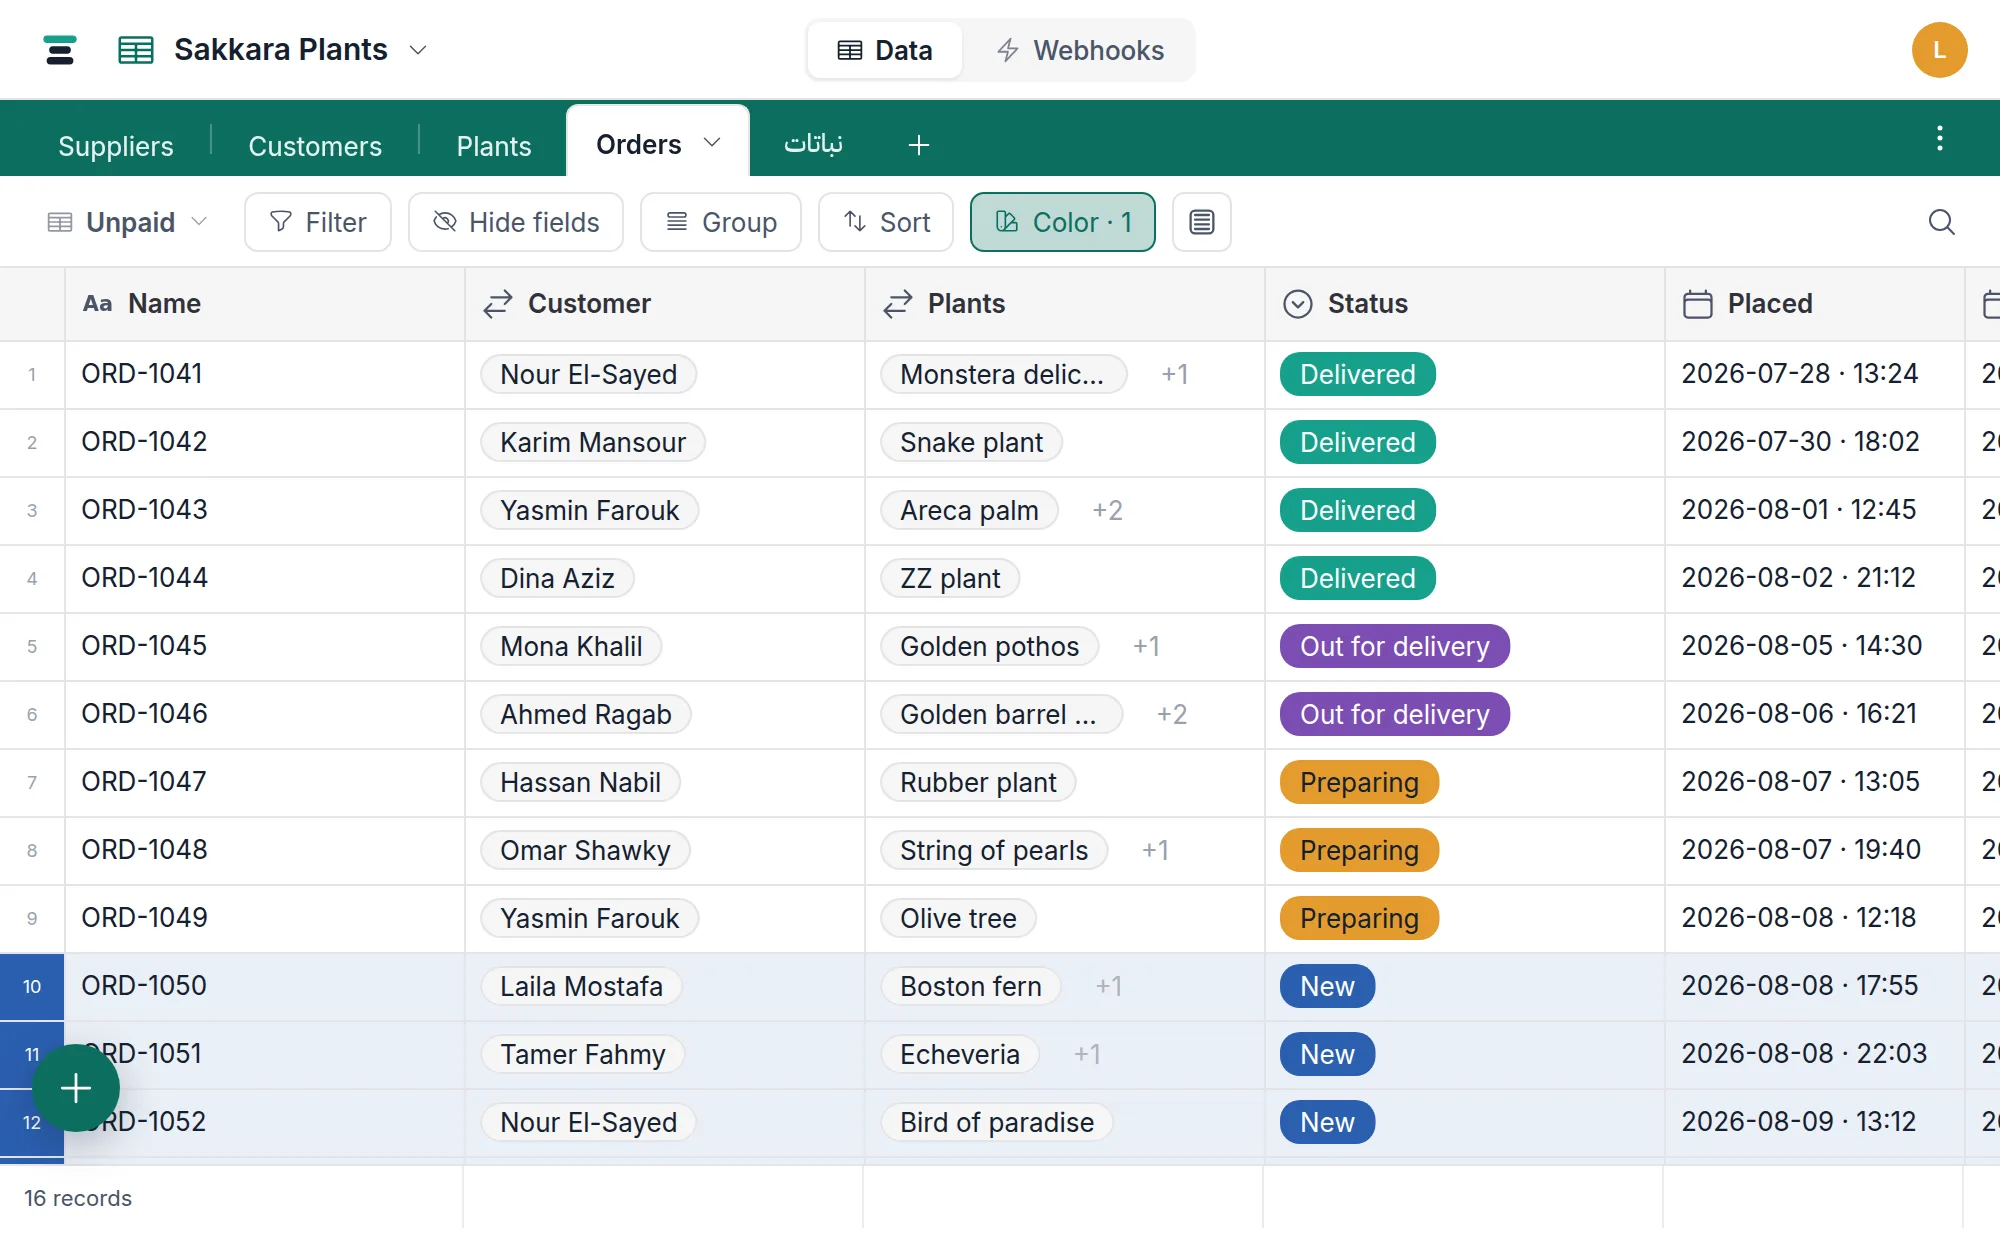
Set one
- Hover the footer under a column — a quiet Summarize appears. Click it. On a phone, tap the footer under the column: there is no hover to wait for, so the row is live where you touch it.
- Pick an aggregation from the menu. None clears it.
- The value sits right-aligned under its column, labeled —
SUM 78,450— and is saved with the view.
The leftmost slot isn't a menu: it's the record count for the current view, and it turns into a Delete N action when rows are selected.
What each field type offers
The menu is built per type — the server refuses anything off this list, so the list is the truth:
- Every summarizable field: Filled, Empty, Unique, Percent filled.
- Numbers — number, currency, percent, rating, duration, number formulas and rollups: all of the above plus Sum, Average, Median, Min, Max, Range, Spread (standard deviation), Lower quarter, Upper quarter, Most common.
- Dates (and date formulas/rollups): Earliest, Latest plus the counts.
- Checkbox: Checked, Unchecked, Percent filled.
- Text fields: the counts plus Most common. Selects and members skip Most common — they get something better: hover their summary and a small distribution pops up, each value with its count and a bar. Checkboxes get the same hover breakdown.
- Multi-select: the counts.
- Attachments, linked records, lookups: Filled, Empty, Percent filled — how many records have something there. For arithmetic across a link, that's what a rollup is for.
- Buttons: nothing — a button holds no value.
Averages and the distribution stats show at least two decimals, so a median doesn't round itself into a lie; currency and percent keep their symbols.
Where summaries live beyond the plain grid
On a grouped grid the same summaries run twice: each group's footer computes them over its own records, and the page bar at the bottom keeps the whole view's value. A collapsed group keeps showing its summaries — a folded month still totals. Sum of Total per status, and overall, in one screen.
The calendar, gallery and board don't carry the summary bar — their footers show the record count. Summaries are a column instrument, and only the grid layouts have columns.
The questions people ask
Is the summary affected by the filter? Yes — that's the design. The summary describes what the view describes. Change the filter and the number recomputes; search narrows it too.
Why is my summary blank instead of 0? A sum or min over no values has
no value — blank is the honest render. Count-family summaries (Filled,
Unique, …) do show 0, because zero of something is a real answer.
Can the API read a summary? Not as a stored thing — summaries are view furniture, computed on request. Over the API, fetch the records and aggregate, or keep a rollup field if the number belongs in the data. See /docs/api.
Do ten summaries cost ten queries? No — every summary the view has set is computed in one query. Setting several is a fine habit, not a tax; they recompute together as records change and as the filter moves.